THE LEAP LABS ENGAGES WITH IMPEL, A TAMPA FLORIDA STARTUP.

Learn more

App Design

Arista

A zero-trust networking and data center observability globally

Client:
Cognitive Cloud Networking
Role:
Lead UX / UI Partner
Tools Used:
Sketch, Axure, Zeplin, Svgator, Google Docs
Year:
2023

Overview

In 2023, The Leap Labs partnered with Arista Networks to modernize the user experience of their enterprise-grade management platforms. Our engagement focused on refining the MVP for new security-focused modules, turning complex network telemetry into actionable, visual intelligence. By delivering high-fidelity prototypes that balanced technical density with modern UX, we helped Arista continue its mission of delivering software-driven networking to the Fortune 500.


All communications are monitored, tracked and recorded for extensive reporting.

  • The Challenge: Arista is known for its incredible "under-the-hood" engineering. The challenge was to create a UI that was as powerful as their CLI (Command Line Interface) but significantly more efficient for modern DevOps teams.
  • The Leap Labs Solution: We acted as a force multiplier for Arista’s internal design team, providing specialized expertise in high-density data visualization and rapid prototyping.
  • The Outcome: The designs and UX frameworks developed in 2023 have become integral to Arista’s push toward AI-driven network operations (AIOps), solidifying their position as a primary competitor to legacy providers like Cisco.

Real-Time Observability at Global Scale

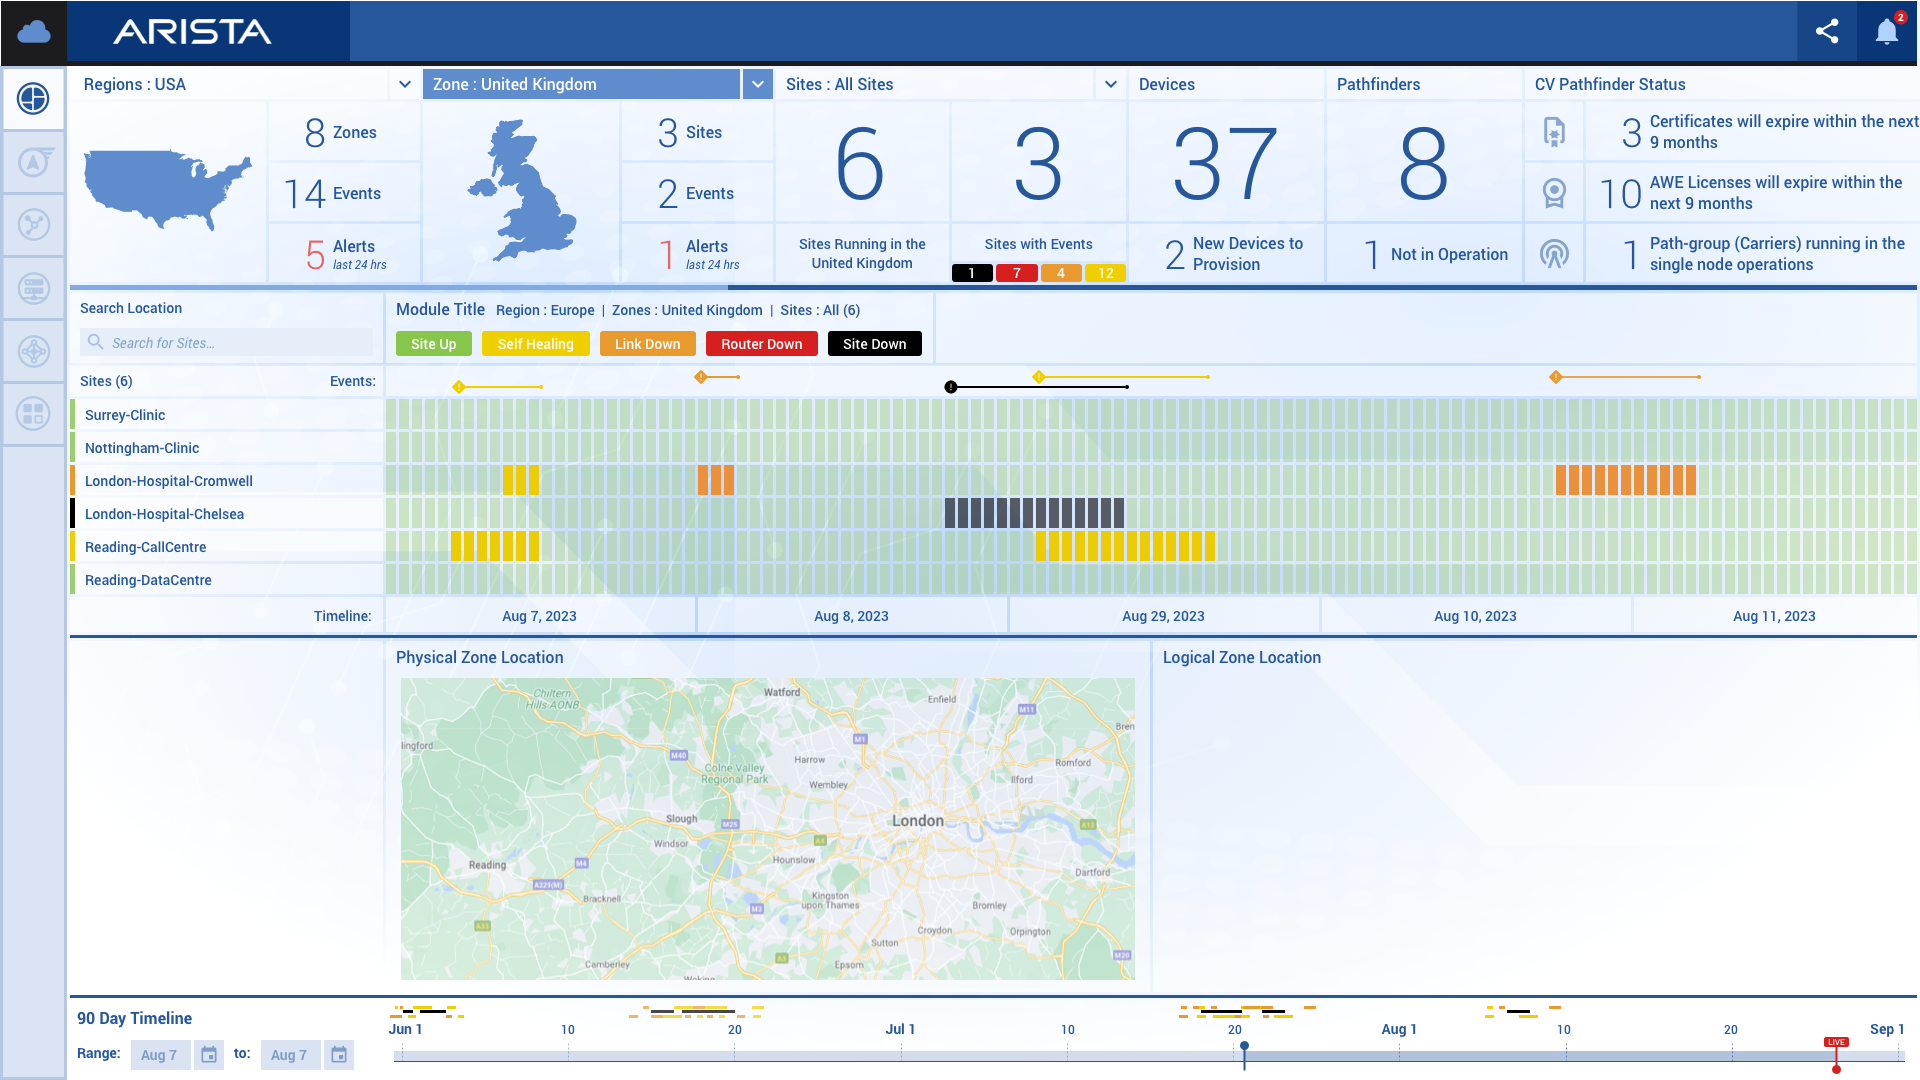
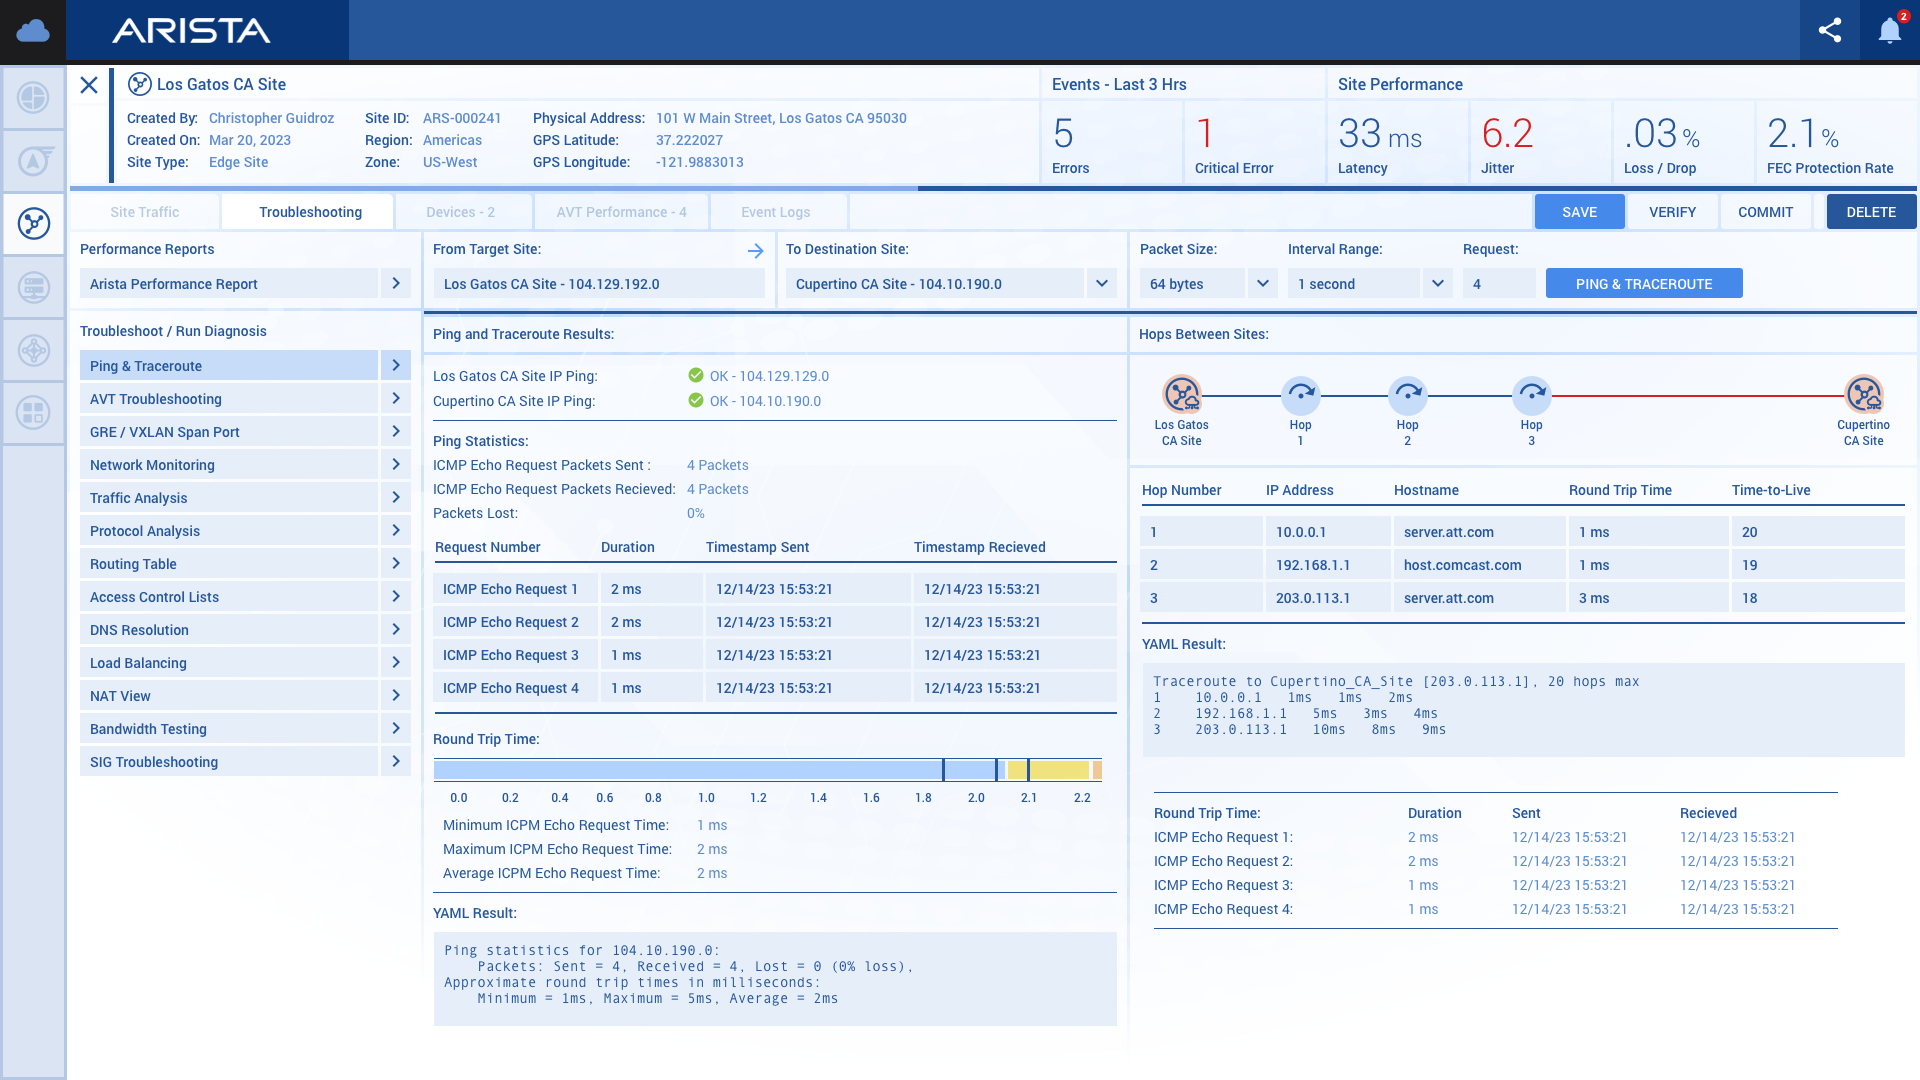
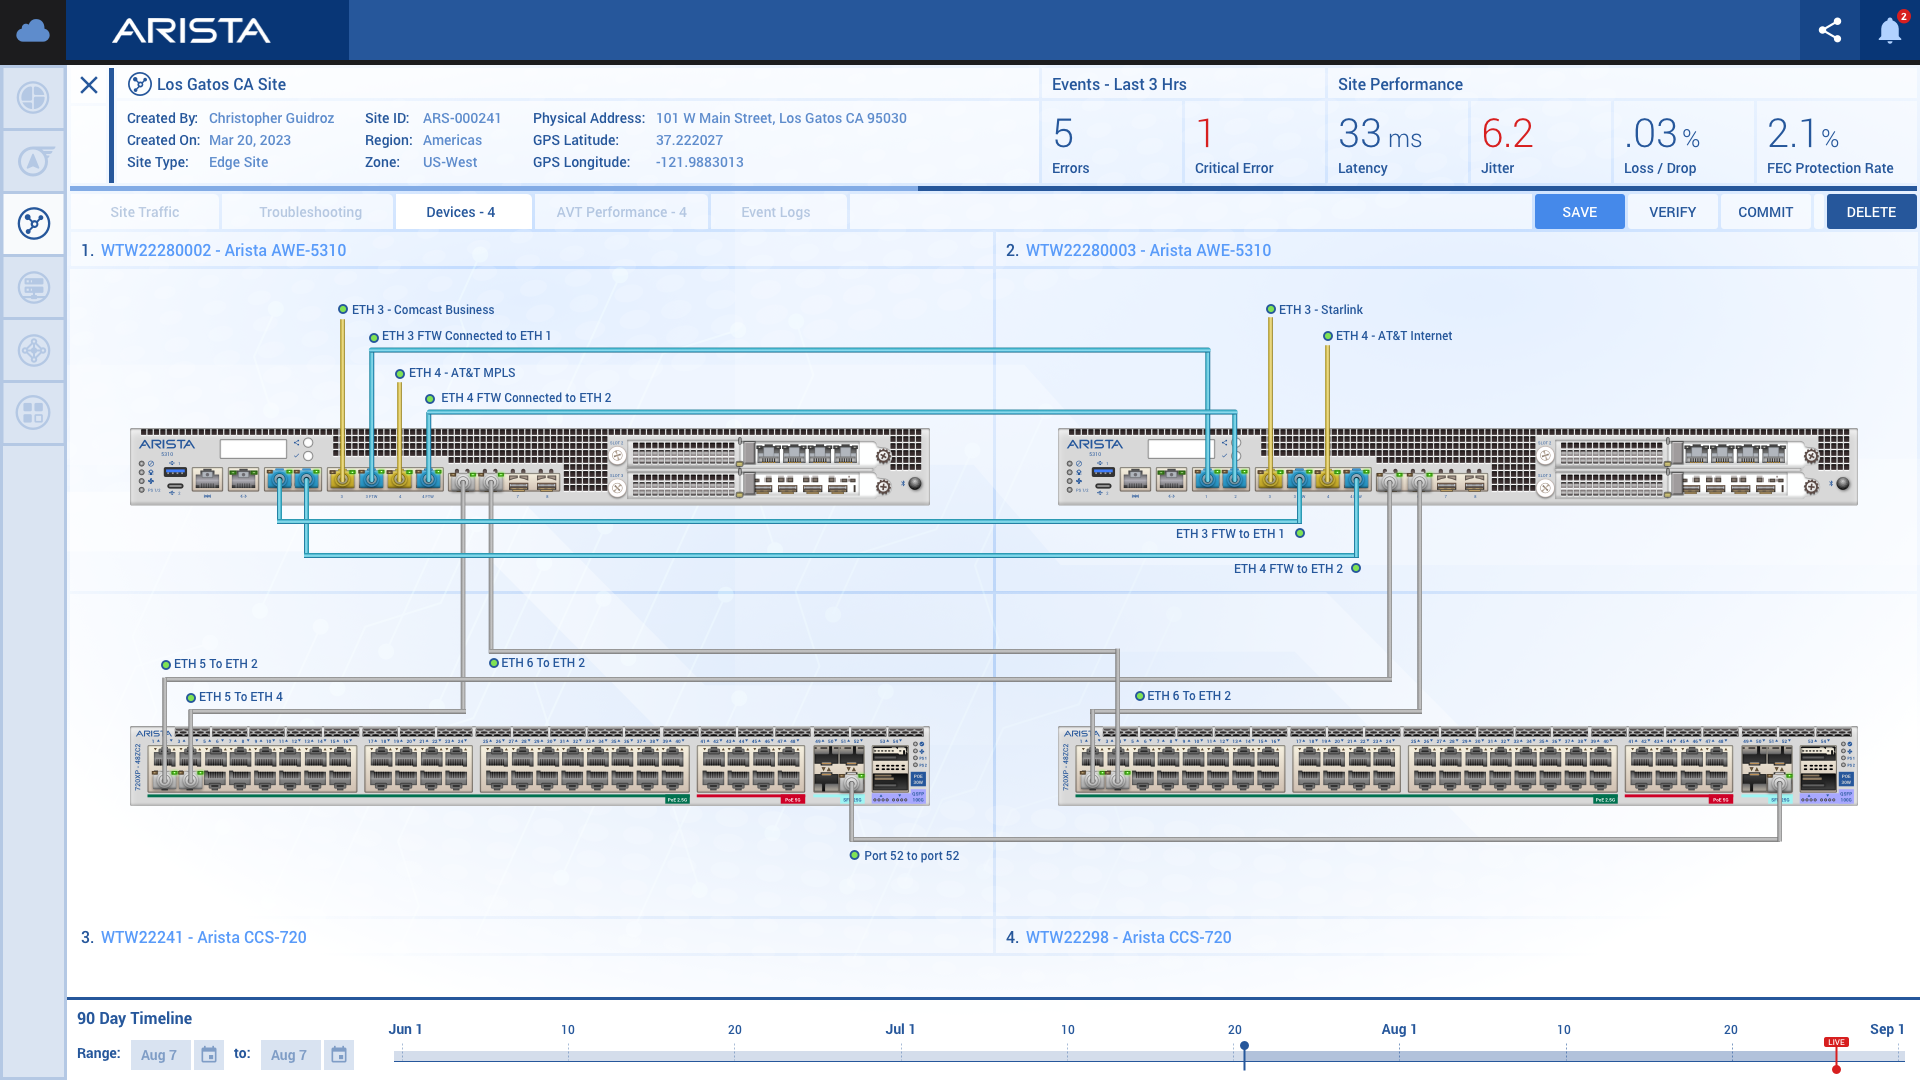
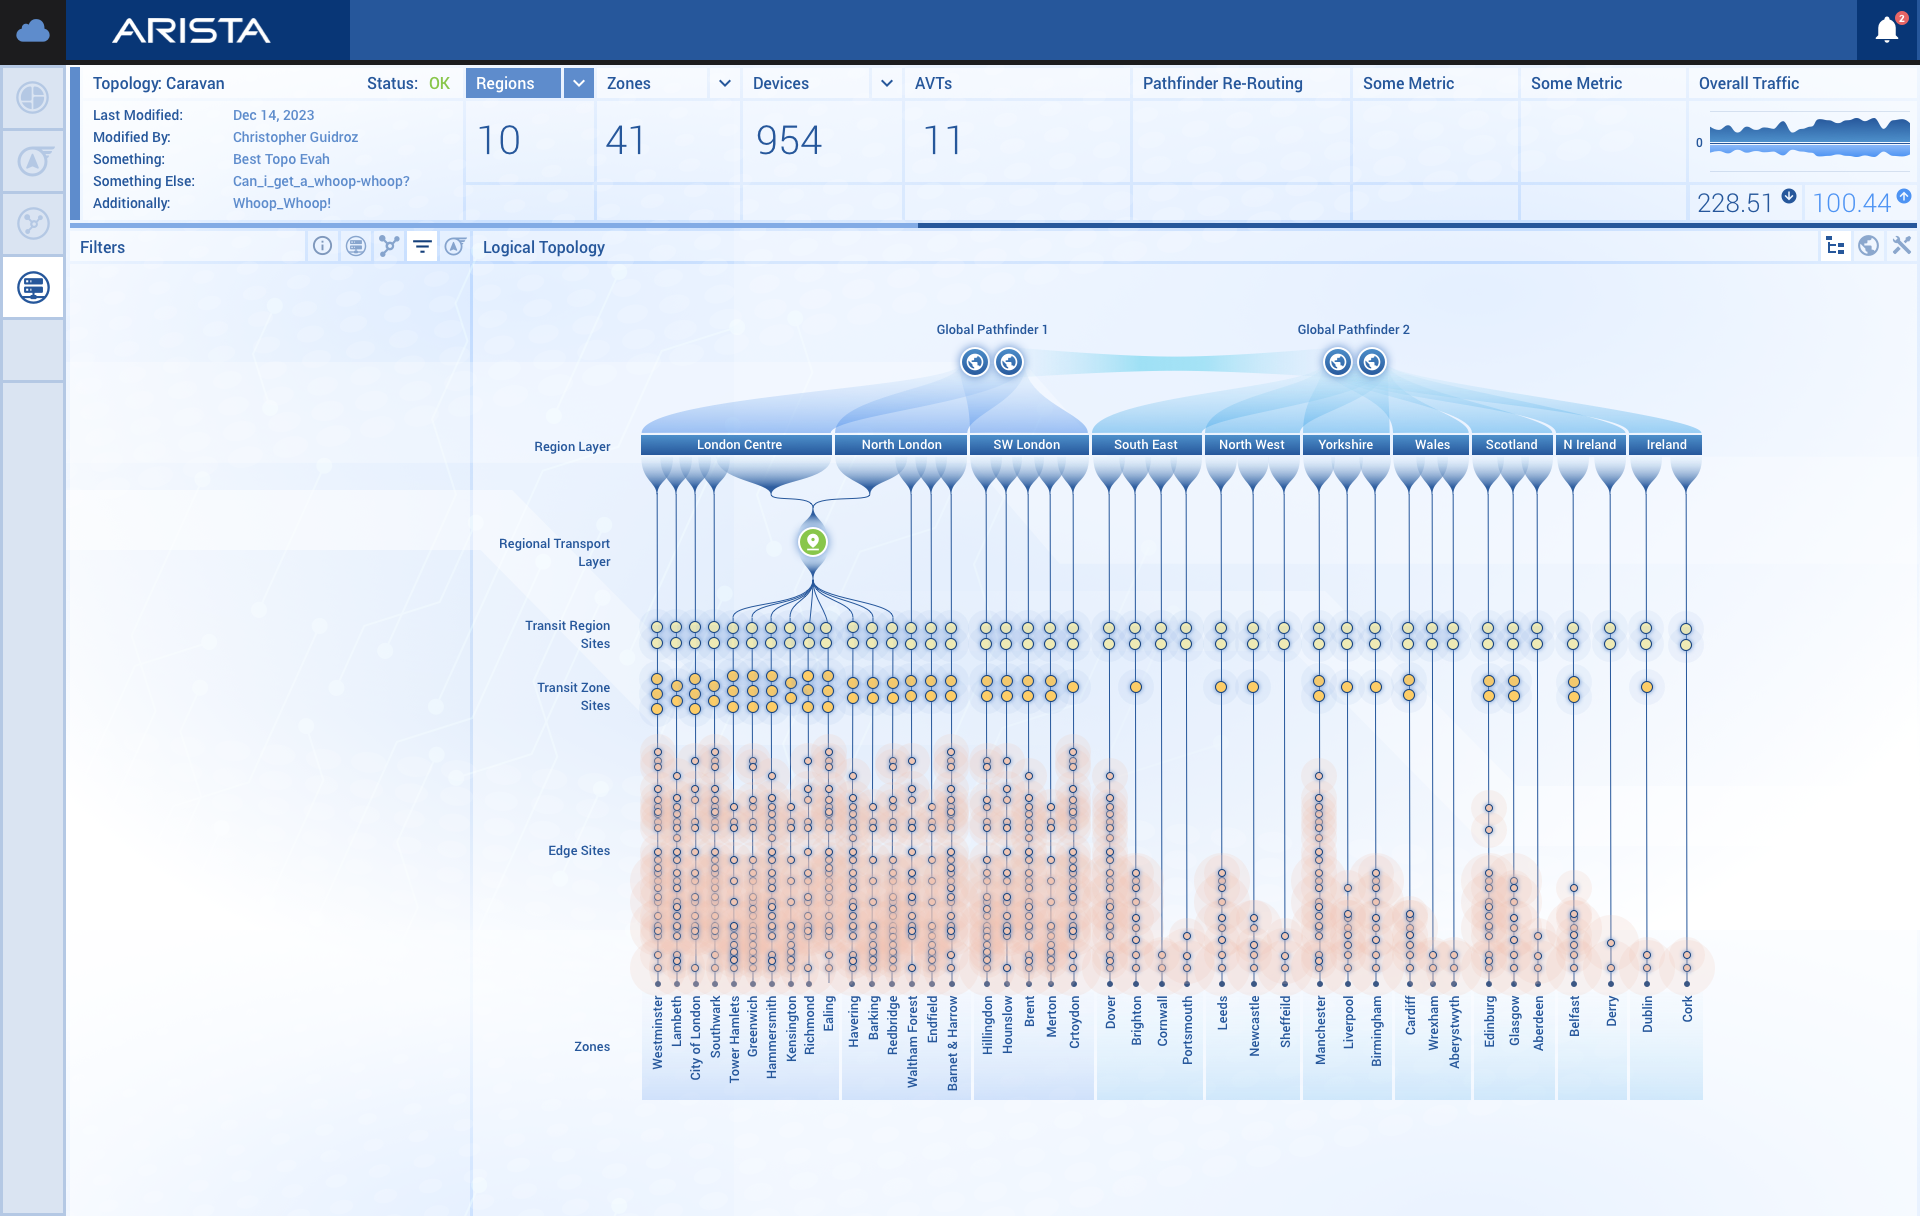
We designed the central Command Center for Arista’s network operators. This interface provides a unified view of thousands of switches and access points. The challenge was to display millions of data points without overwhelming the user. We implemented a "Signal-over-Noise" design philosophy, highlighting critical anomalies while keeping standard performance metrics in the background.

Key Features:

  • Global Health Heatmaps: Instant identification of regional performance issues.
  • Automated Incident Scoring: Prioritizing network events based on business impact.
  • Telemetry Streaming: Visualizing sub-second data updates across the fabric.

Zero-Trust Visibility and Guardian Air

  • This section showcases our work on Arista’s security modules. We designed the interface for Guardian Air, focusing on identifying rogue devices and unauthorized access attempts in real-time. The UI uses behavioral analytics to visualize how devices are interacting, allowing security teams to "hunt" for threats within their own infrastructure.
  • Key Features:
    • Rogue Device Mapping: Pinpointing the physical location of unauthorized signals.
    • Audit-Ready Compliance: One-click reporting for security posture and regulatory standards.
    • Automated Containment: Visual workflows to quarantine suspicious devices instantly.
  • Navigating the Complexities of the Cloud

  • Troubleshooting a data center requires understanding "Pathing." We designed an interactive, 3D-inspired topology map that allows engineers to trace a packet’s journey across every hop in the network. By simplifying the visualization of complex routing protocols, we reduced the Mean Time to Repair (MTTR) for critical network outages.
  • Key Features:
    • Dynamic Hop Tracing: Visualizing latency and packet loss at every point of the journey.
    • Virtual vs. Physical Mapping: Correlating software-defined logic with physical hardware.
    • Searchable Infrastructure: Instant "Find" functionality for any device or MAC address in the network.
  • Granular Diagnostics for the Cognitive Campus

  • For distributed enterprises, we designed site-specific "Deep Dive" views. This UI allows a local admin to see the exact Wi-Fi experience of every user in their building—from signal strength to application performance. We used a "Card-Based" layout to make data easily digestible for both technical engineers and IT managers.
  • Key Features:
    • Ping & Trace Tooling: Integrated diagnostic tools that run directly from the browser.
    • User Experience Scoring: Metrics based on actual client-side connectivity.
    • Traffic Breakdown: Visualizing which applications (Zoom, YouTube, AWS) are consuming bandwidth.