THE LEAP LABS ENGAGES WITH IMPEL, A TAMPA FLORIDA STARTUP.

Learn more

App Design

Truecue

An Start-up in London

Client:
Accelerating Data-Driven Decisions
Role:
Lead UX / UI Partner
Tools Used:
Figma, Sketch, Axure, Zeplin, Illustrator, Google Docs
Year:
2021

Overview

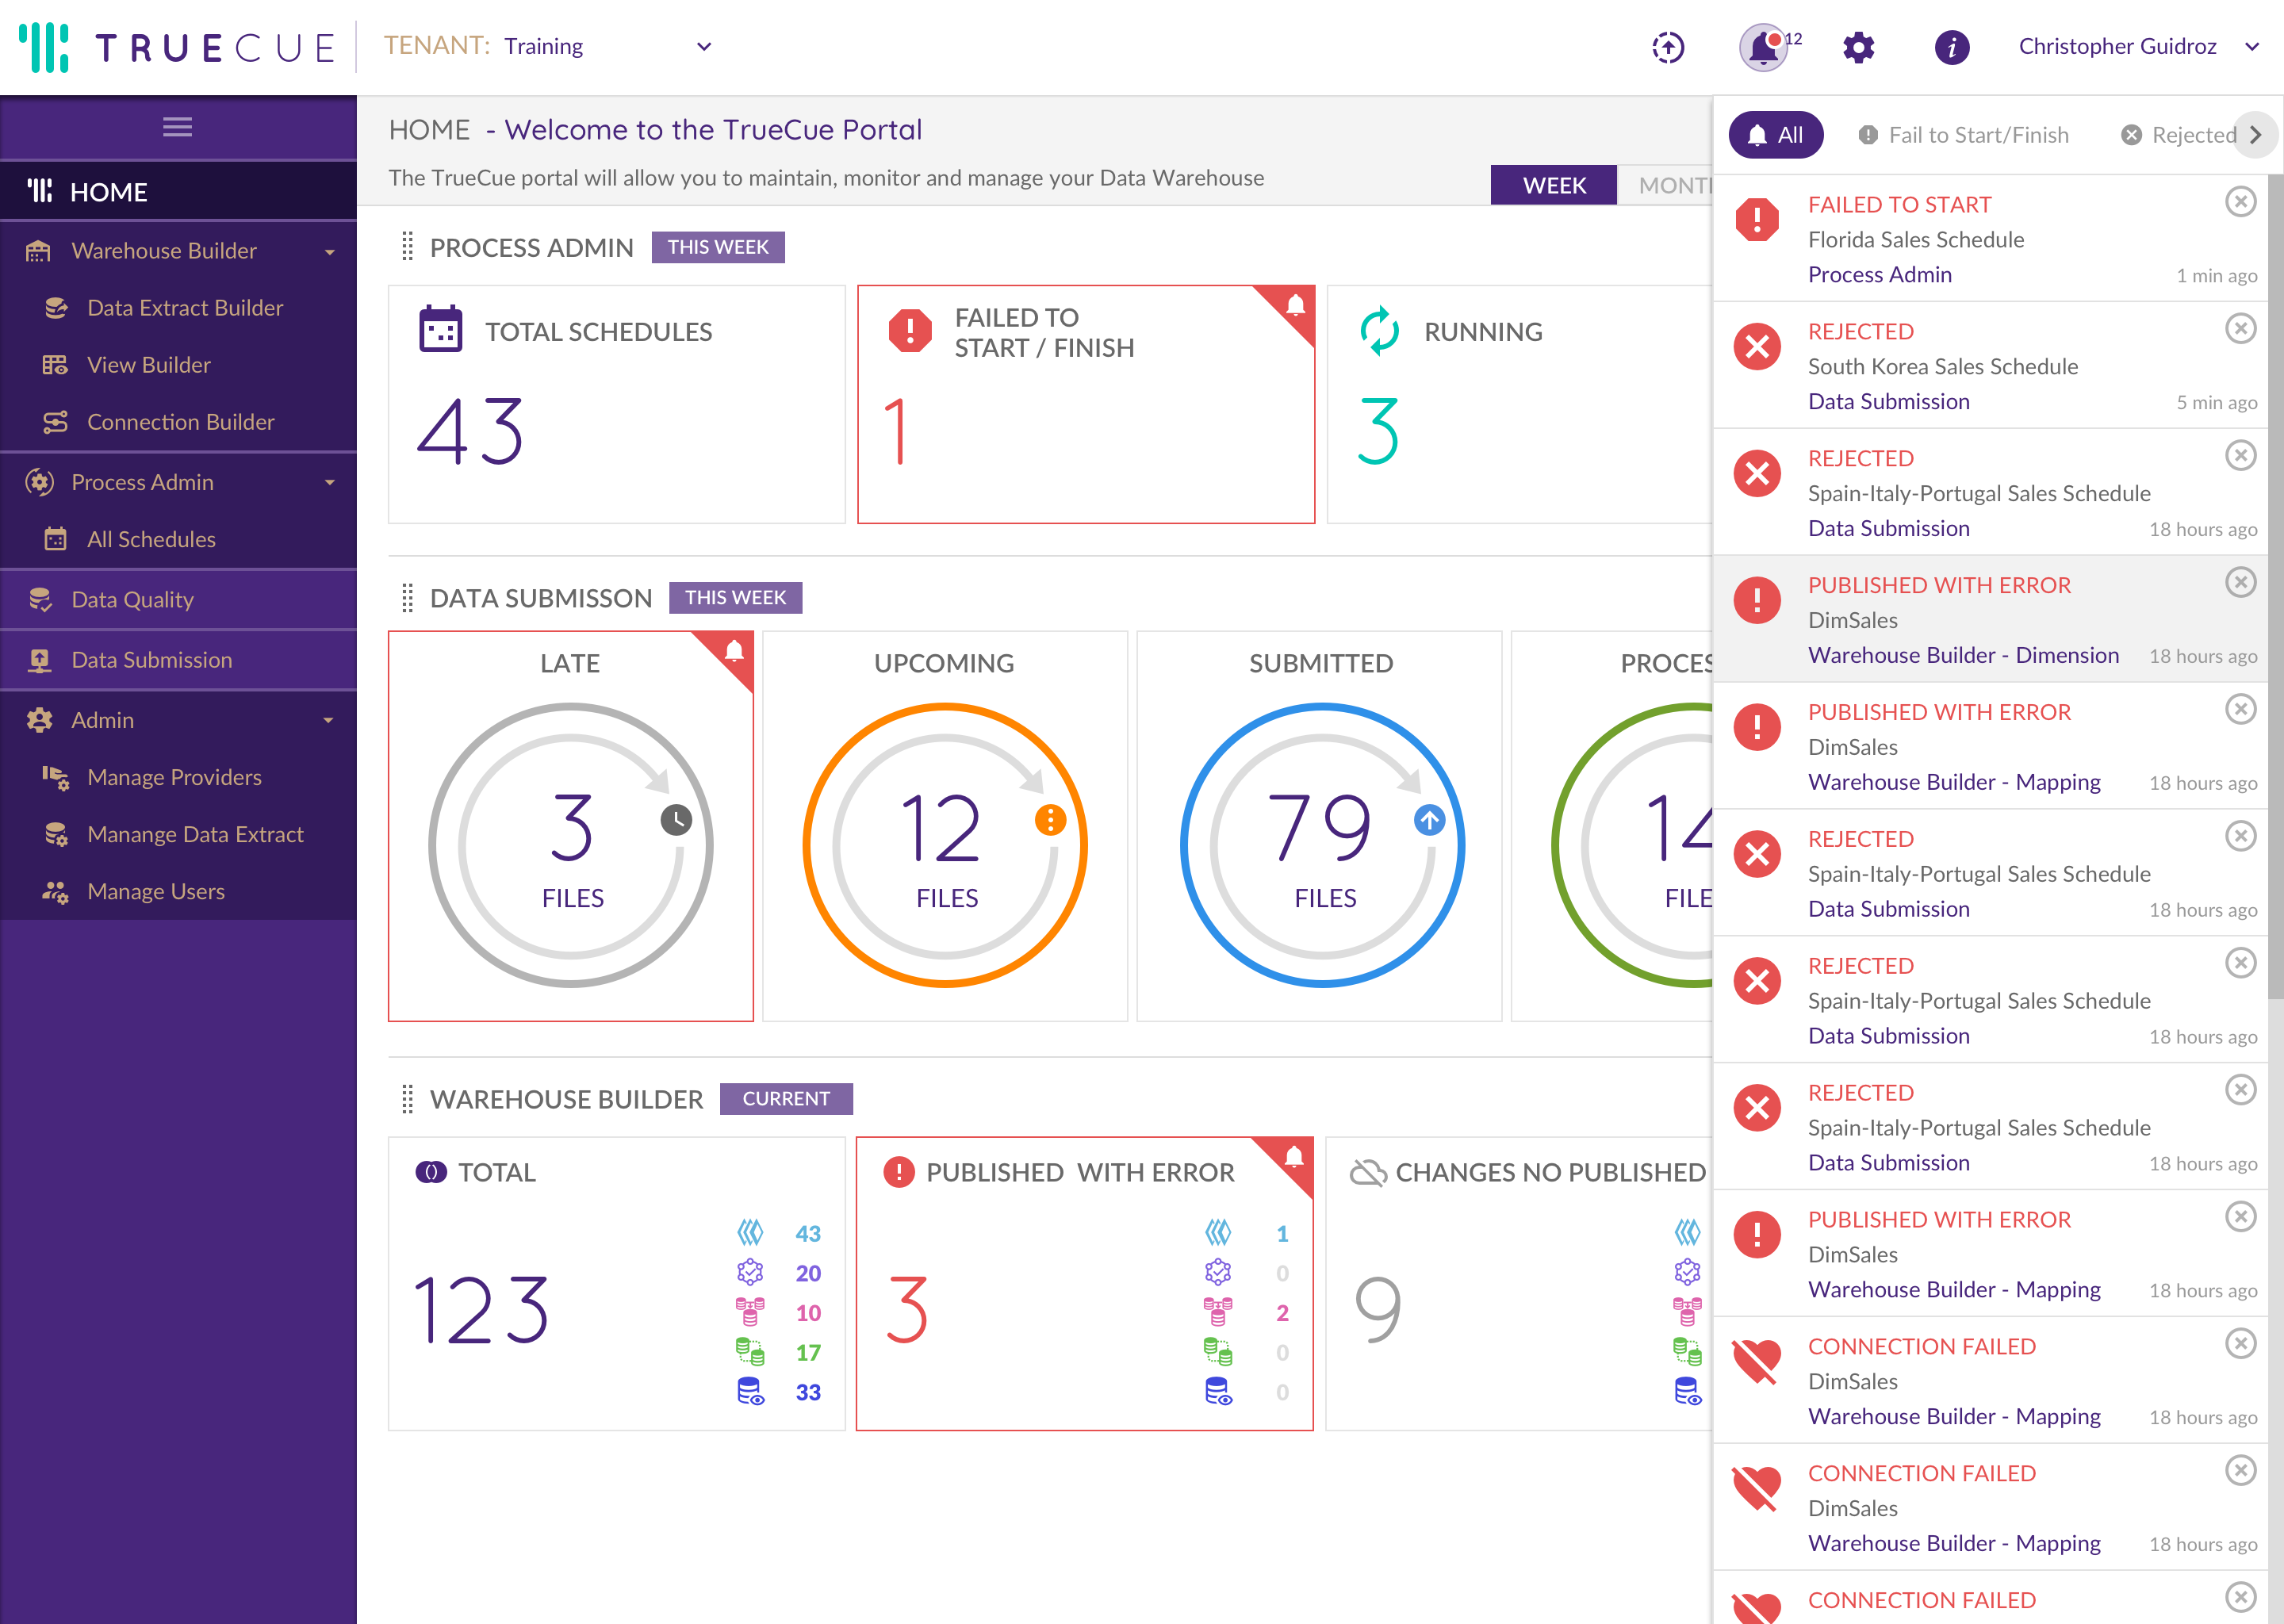
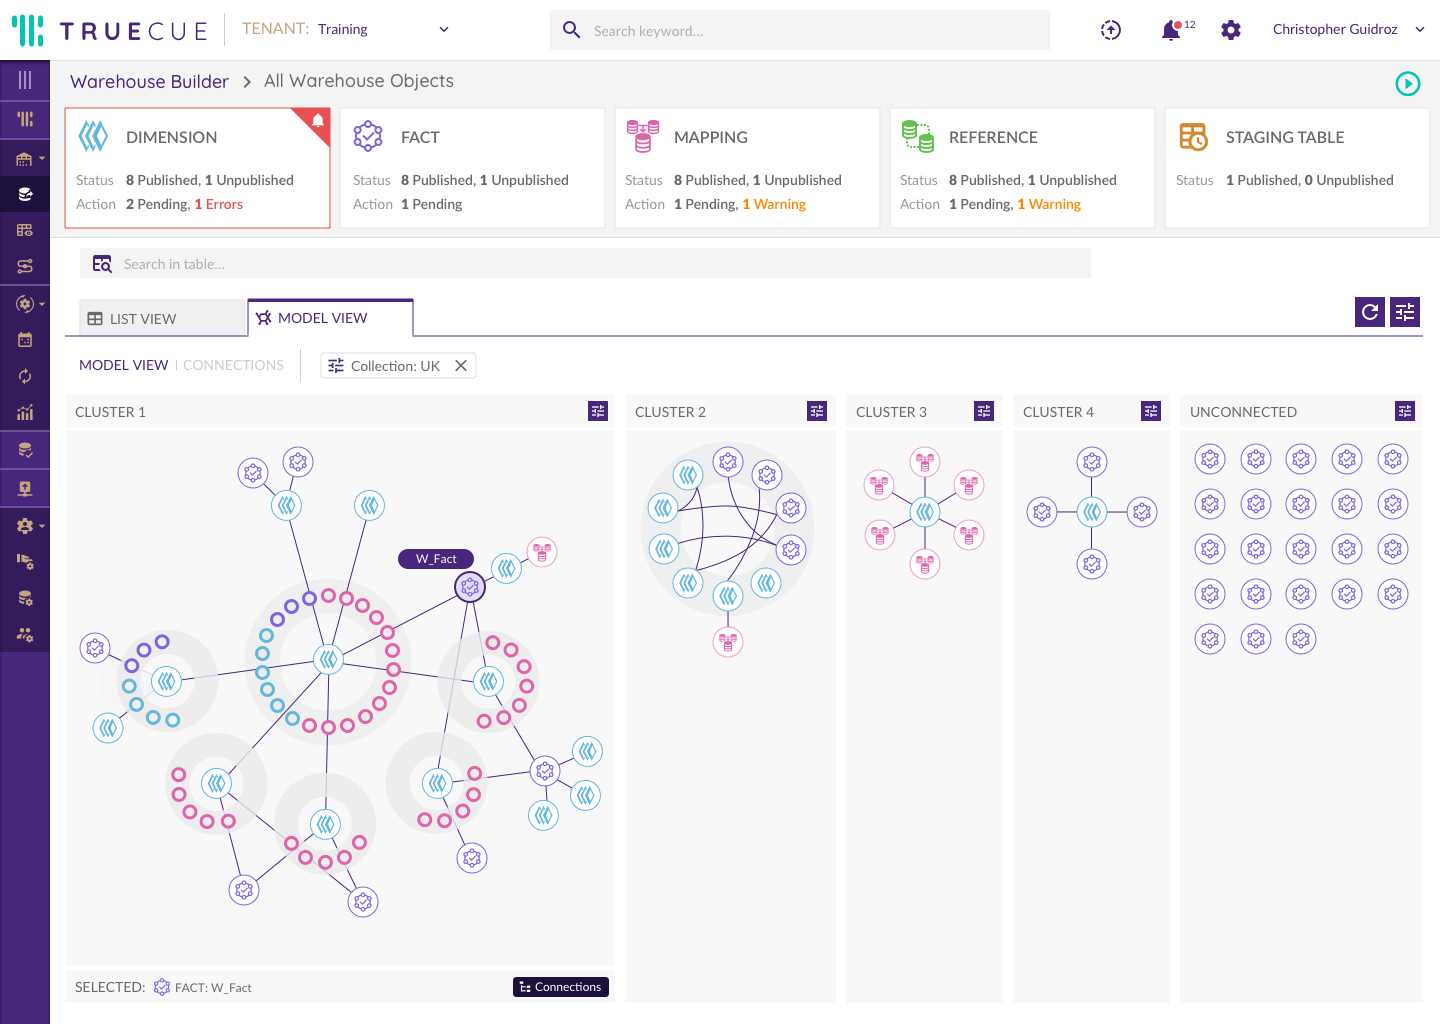
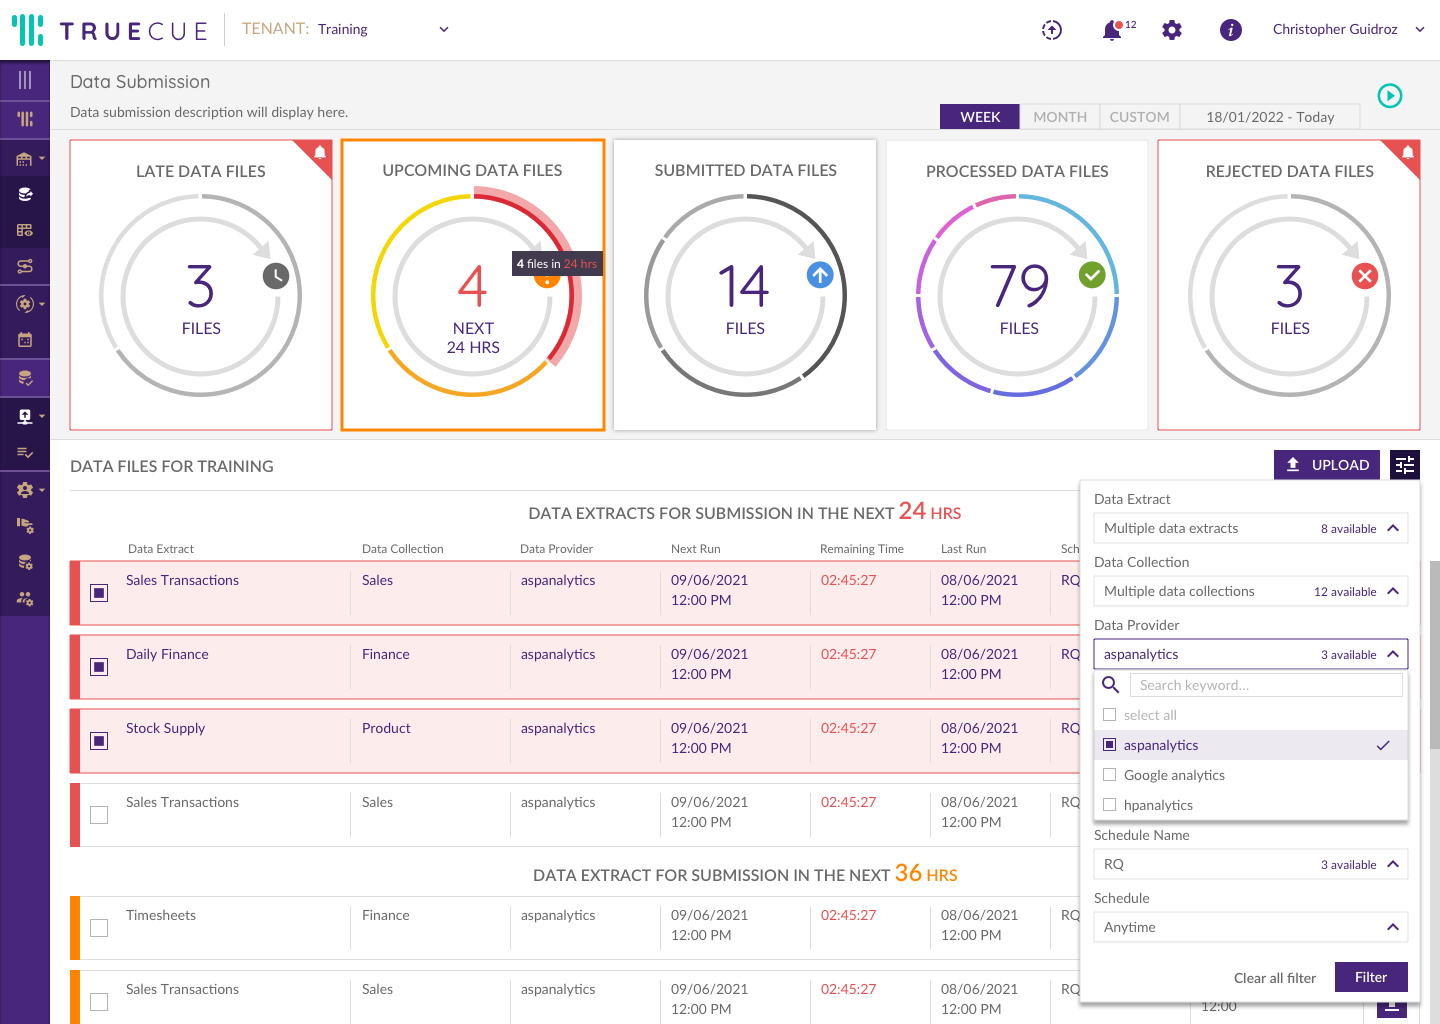
In 2021, Truecue partnered with The Leap Labs to define the user experience for their unified data platform. We designed the core MVP and interactive prototypes that visualized their unique "data warehouse automation" technology. This design-led approach was critical in validating their product-market fit and showcasing the platform's ability to reduce data engineering time by up to 80%, ultimately supporting their strategic growth and market positioning.

  • The Challenge: Data tools are often built by engineers for engineers. Truecue needed to make data accessible to the business owner.
  • The Leap Labs Solution: We transformed the complexity of data warehousing into a streamlined, visual journey. Our work focused on reducing the "Time to Insight," ensuring that the platform was not only powerful but also delightful to use.
  • Impact: The MVP and design system created in 2021 laid the foundation for Truecue to compete with major incumbents, positioning them as a leader in the next generation of automated analytics.
  • Simplifying Complex Data Engineering

  • Traditionally, building a data warehouse takes months of manual coding. We designed a visual orchestration interface that allows users to connect data sources (like Salesforce, SAP, or SQL) and automate the ETL (Extract, Transform, Load) process. This "Low-Code" approach empowers business analysts to manage data pipelines without relying on heavy engineering resources.
  • Key Innovation:
    • Visual Pipeline Builder: Drag-and-drop mapping of data sources.
    • Automated Schema Detection: Reducing manual errors in data structuring.
    • Real-Time Data Sync Monitoring: At-a-glance status of global data refreshes.
  • Turning Big Data into Executive Clarity

  • The goal of Truecue is to provide a "Single Source of Truth." We designed high-level executive dashboards that aggregate KPIs across different business units. By focusing on "Information Density" and "Visual Hierarchy," we ensured that leadership teams could identify trends and anomalies in seconds rather than hours.
  • Key Innovation:
    • Interactive Drill-Downs: Moving from global metrics to row-level data in two clicks.
    • Predictive Analytics Integration: Visualizing "What-If" scenarios and future forecasting.
    • Customizable Reporting: Allowing users to build bespoke views without technical training.
  • Ensuring Trust in Enterprise Data

    Analytics are only as good as the data behind them. We designed a comprehensive Data Quality suite that flags inconsistencies, duplicates, or missing values automatically. The UI provides a "Trust Score" for every dataset, ensuring that stakeholders can rely on the insights they see.

    Key Innovation:

    • Anomaly Detection Alerts: Visual notifications for data outliers.
    • Lineage Mapping: Tracking the history of data from its origin to the final report.
    • Role-Based Security: Secure data access management for global enterprise teams.

    Consumer-Grade UX for Professional Analytics

  • To differentiate Truecue from legacy tools, we brought a "Consumer-Grade" aesthetic to professional data tools. We designed a library of smart visualizations that go beyond standard bar charts, using advanced heatmaps and network graphs to reveal hidden relationships within large-scale datasets.
  • Key Innovation:
    • Responsive Design: Seamless experience across desktop and tablet for "on-the-go" monitoring.
    • Template Library: One-click deployment of industry-specific analytics (e.g., Finance, HR, Supply Chain).