THE LEAP LABS ENGAGES WITH IMPEL, A TAMPA FLORIDA STARTUP.

Learn more

App Design

Pepperdata

An Fintech Start-up in Miami

Client:
Enterprise Software Finteeh
Role:
Lead UX / UI Partner
Tools Used:
Sketch, Axure, Zeplin, Photoshop, Google Docs
Year:
2018-2019

Overview

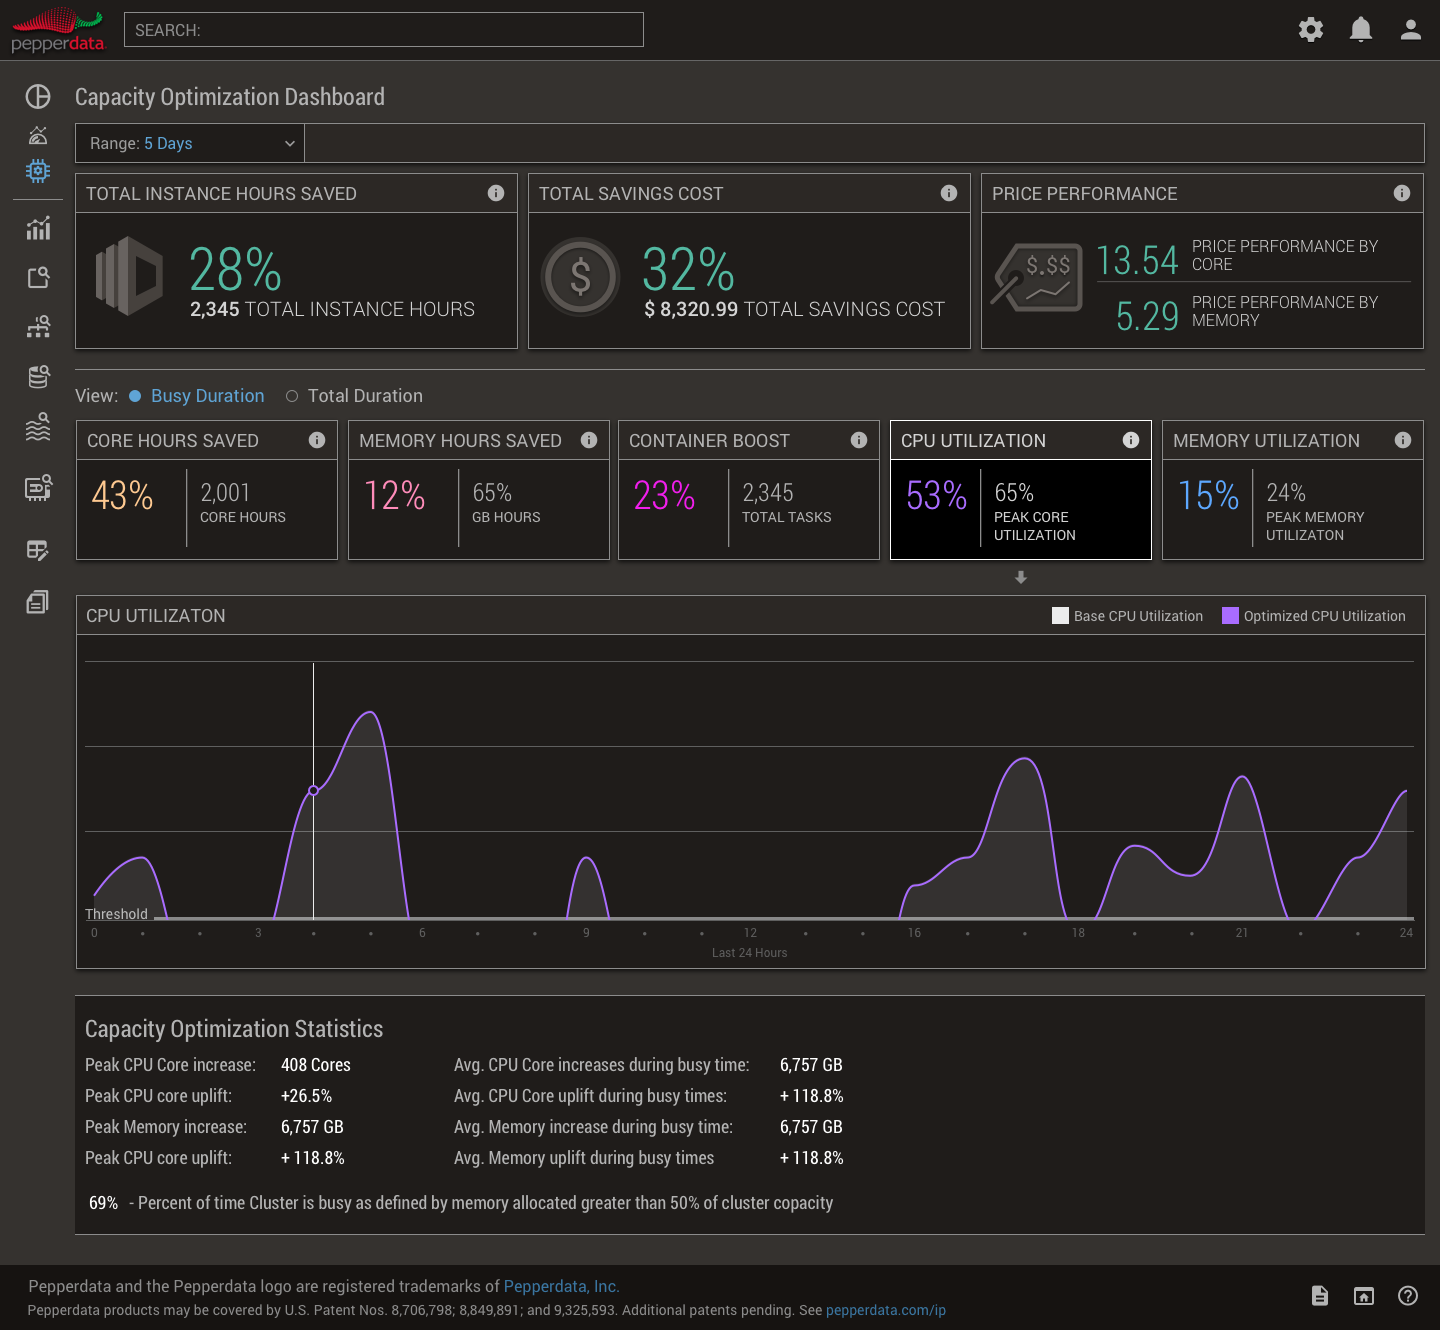
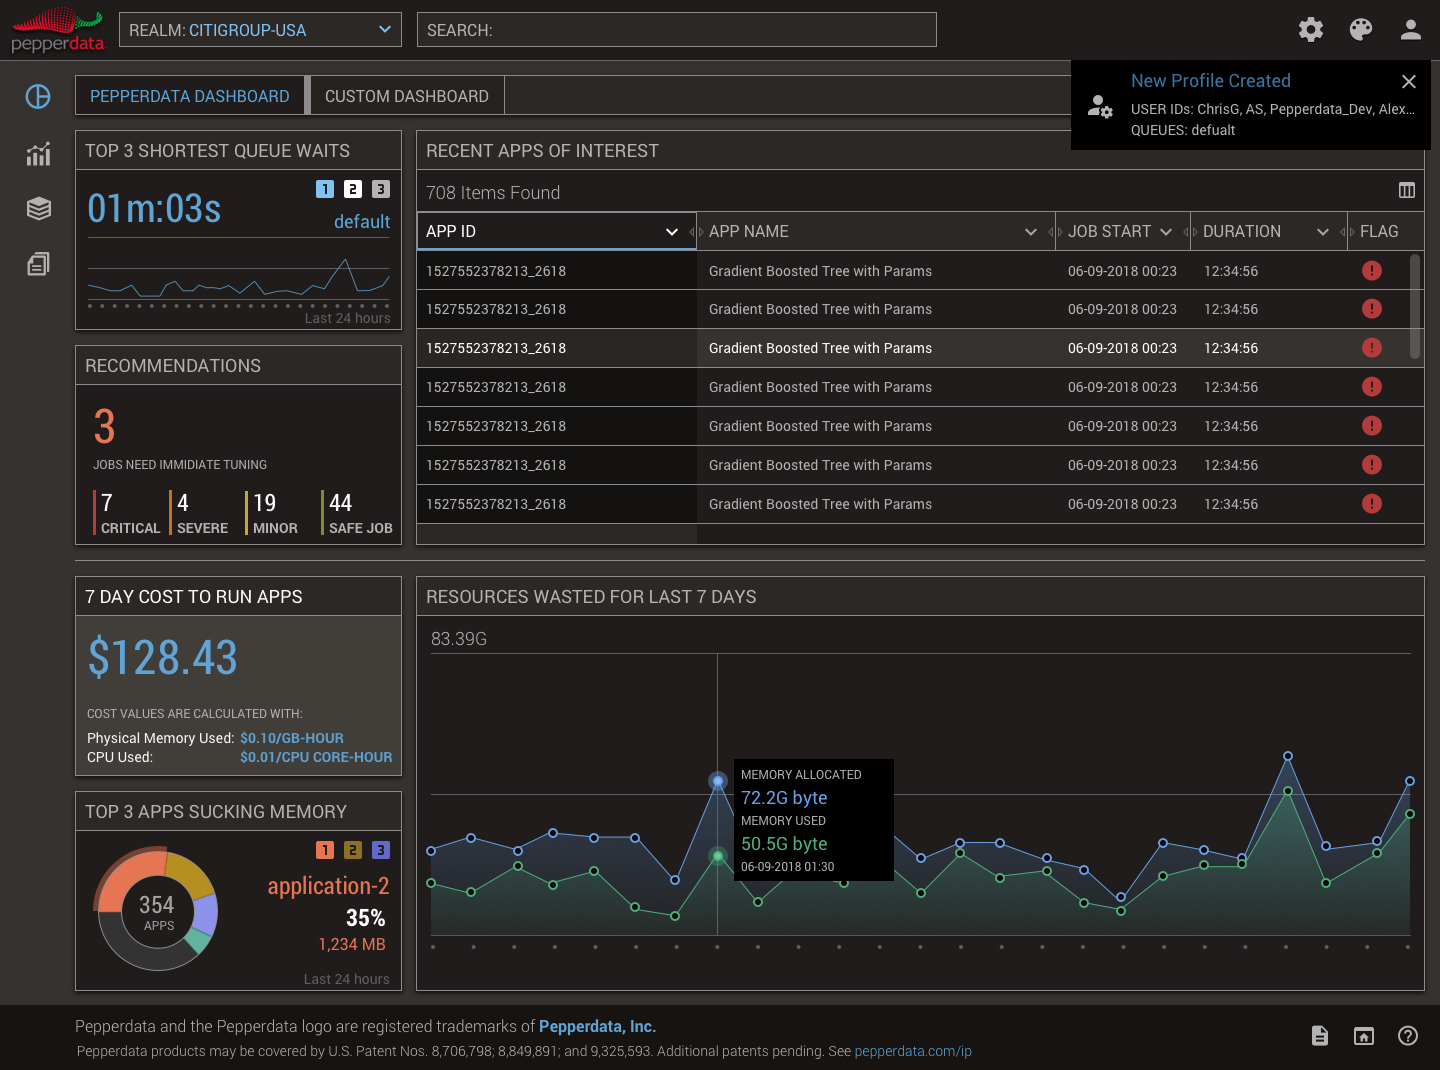
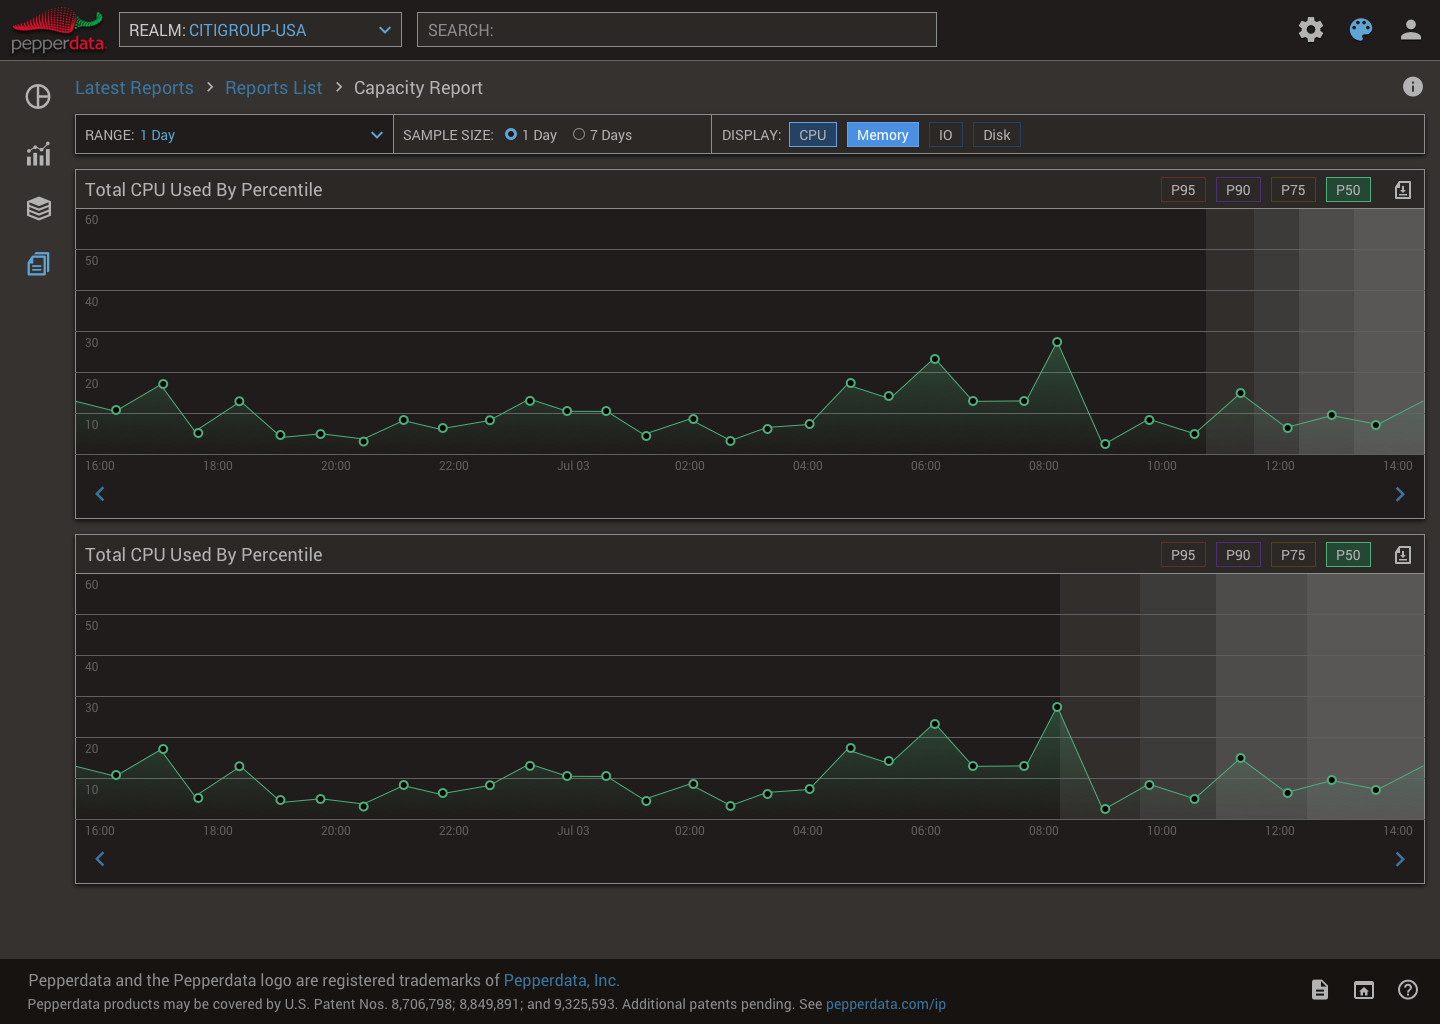
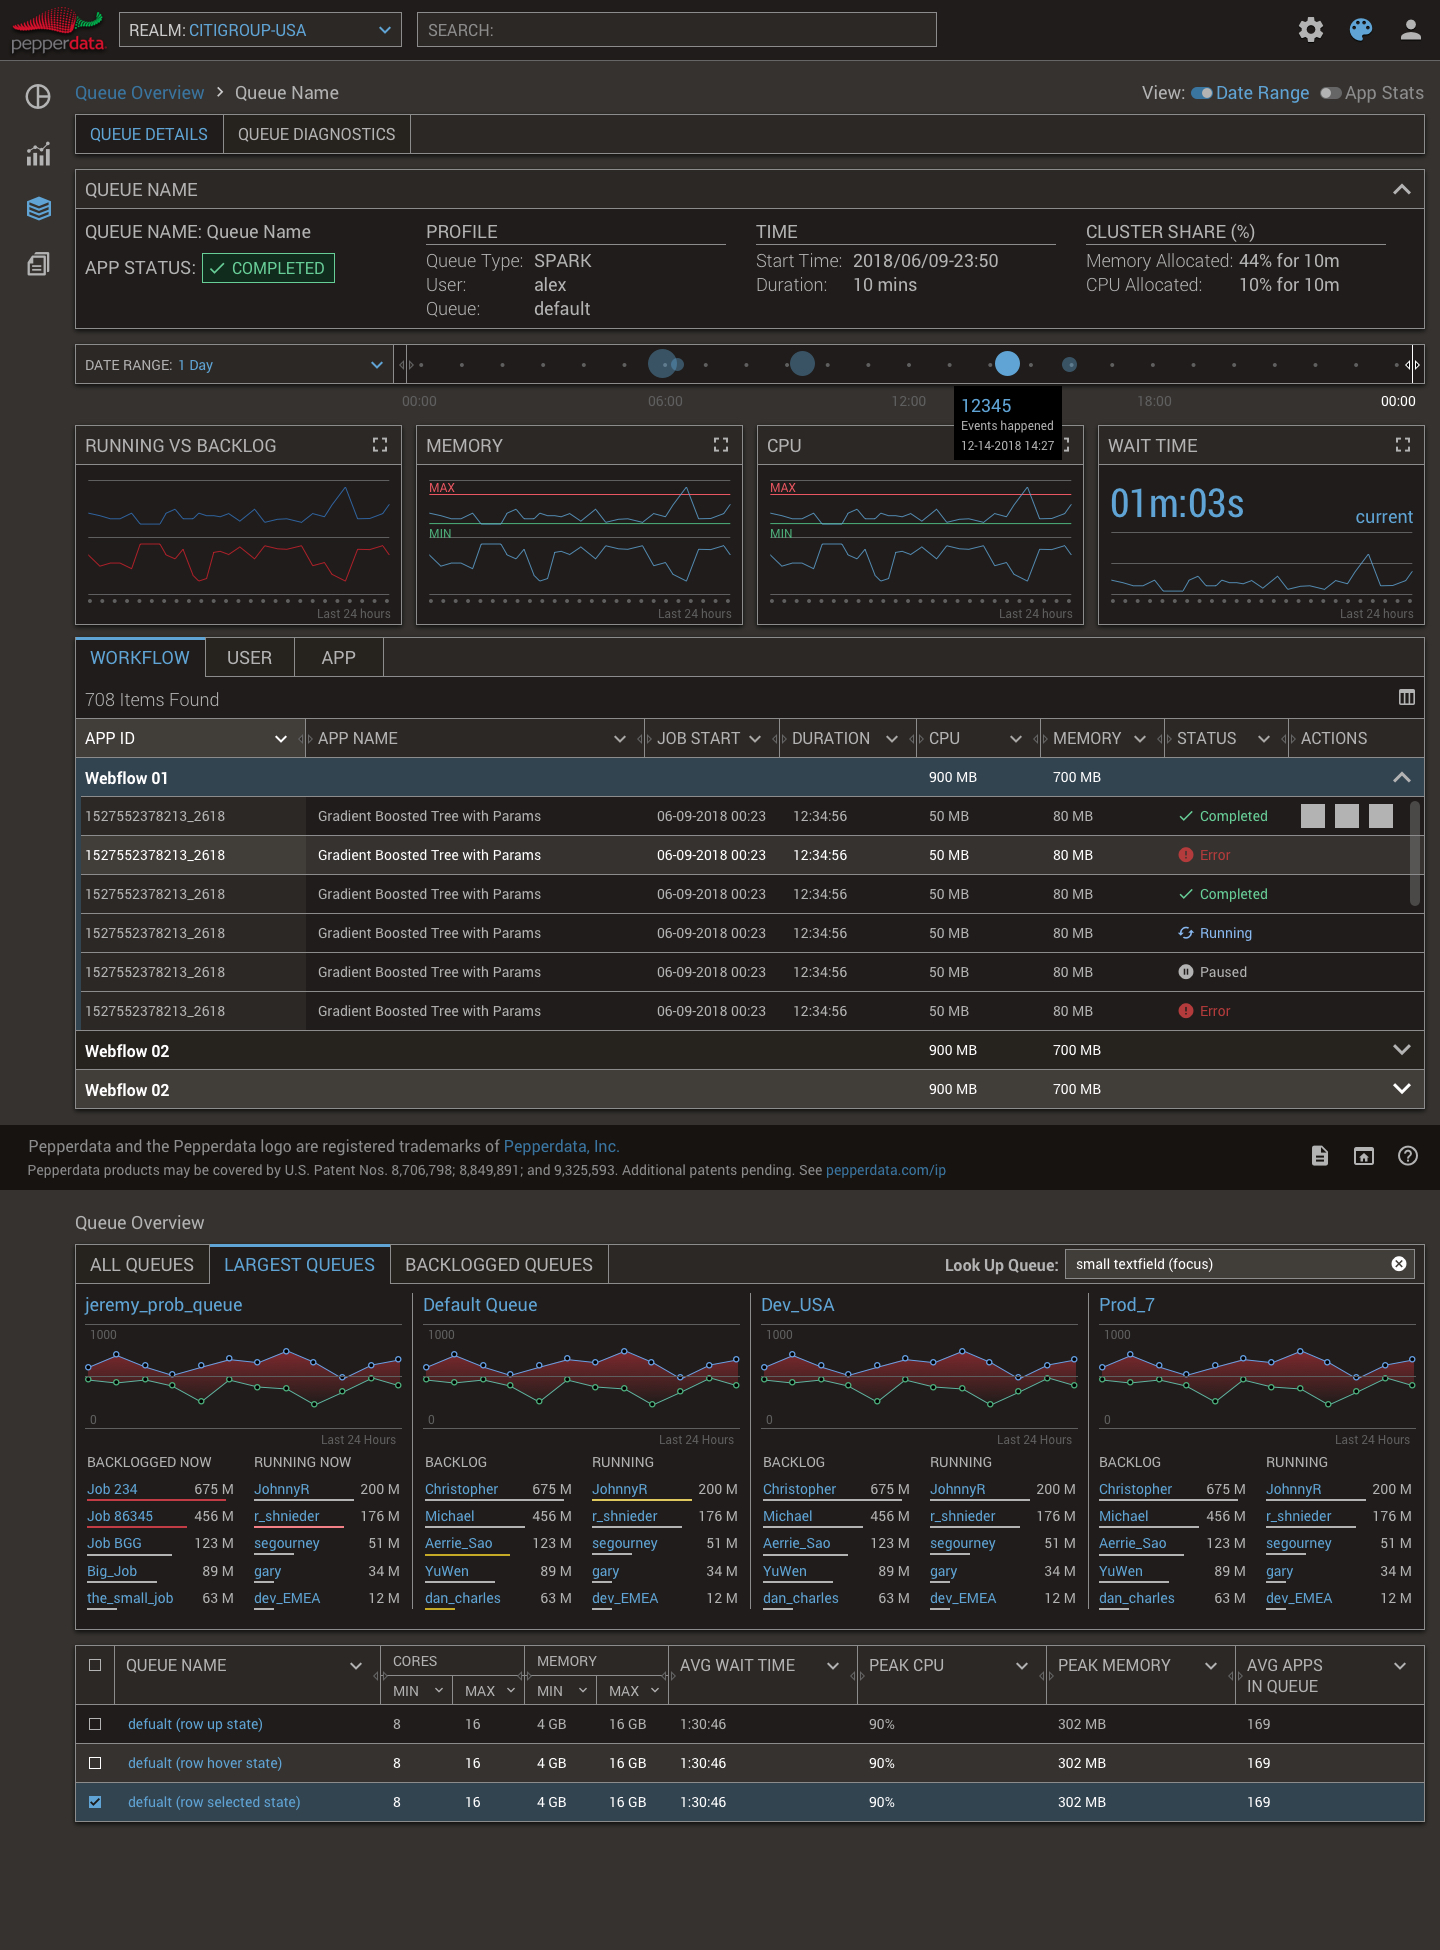
Pepperdata: Real-Time Big Data Observability

Pepperdata provides full-stack observability and automated cost optimization for data-intensive workloads on Kubernetes and Amazon EMR, helping Fortune 100 companies reduce infrastructure spend by up to 47%.

A Single Pane of Glass for Massive Clusters

  • Managing thousands of nodes across hybrid environments requires high-level clarity. We designed the central dashboard to provide an instant health check of the entire big data stack, correlating infrastructure metrics with application performance to surface bottlenecks before they impact SLAs.
  • Key Features Shown: * Real-time CPU & Memory utilization
    • Cluster-wide health scoring
    • Active vs. Pending workload tracking
  • Deep-Dive Application Diagnostics

  • When a Spark job fails or runs slow, engineers need to know why. This interface allows users to drill down into individual jobs to see task-level details, data skew, and resource usage. We focused on making these complex data points actionable to drastically reduce Mean Time to Repair (MTTR).
  • Key Troubleshooting Features:
    • "Wait-Time" analysis for identifies bottlenecks
    • Error log correlation with hardware telemetry
    • Side-by-side job comparisons
  • Autonomous Cost & Waste Management

  • Most cloud clusters are over-provisioned. Our design for the Capacity Optimizer highlights "Reclaimable Waste"—showing exactly how much money is being saved by Pepperdata’s autonomous scaling. The UI visualizes the gap between allocated and actual usage in real-time.
  • Key Features Shown:
    • Cost savings forecasting (ROI tracking)
    • Reclaimed resource metrics (vCPU and GB-Hours)
    • Automated instance-hour reduction charts
  • Financial Accountability for Big Data

  • To solve the problem of "runaway" cloud costs, we designed detailed chargeback reports. This allows IT leaders to attribute specific costs to different business units, departments, or individual users, turning a massive cloud bill into a transparent, accountable budget.
  • Key Features Shown:
    • Usage attribution by Department/Queue
    • Customizable reporting windows
    • Spend trend analysis