THE LEAP LABS ENGAGES WITH IMPEL, A TAMPA FLORIDA STARTUP.
Pensando Systems: Democratizing the Cloud
Pensando (acquired by AMD) provides a programmable DPU (Data Processing Unit) that delivers software-defined networking, storage, and security services at the server edge.
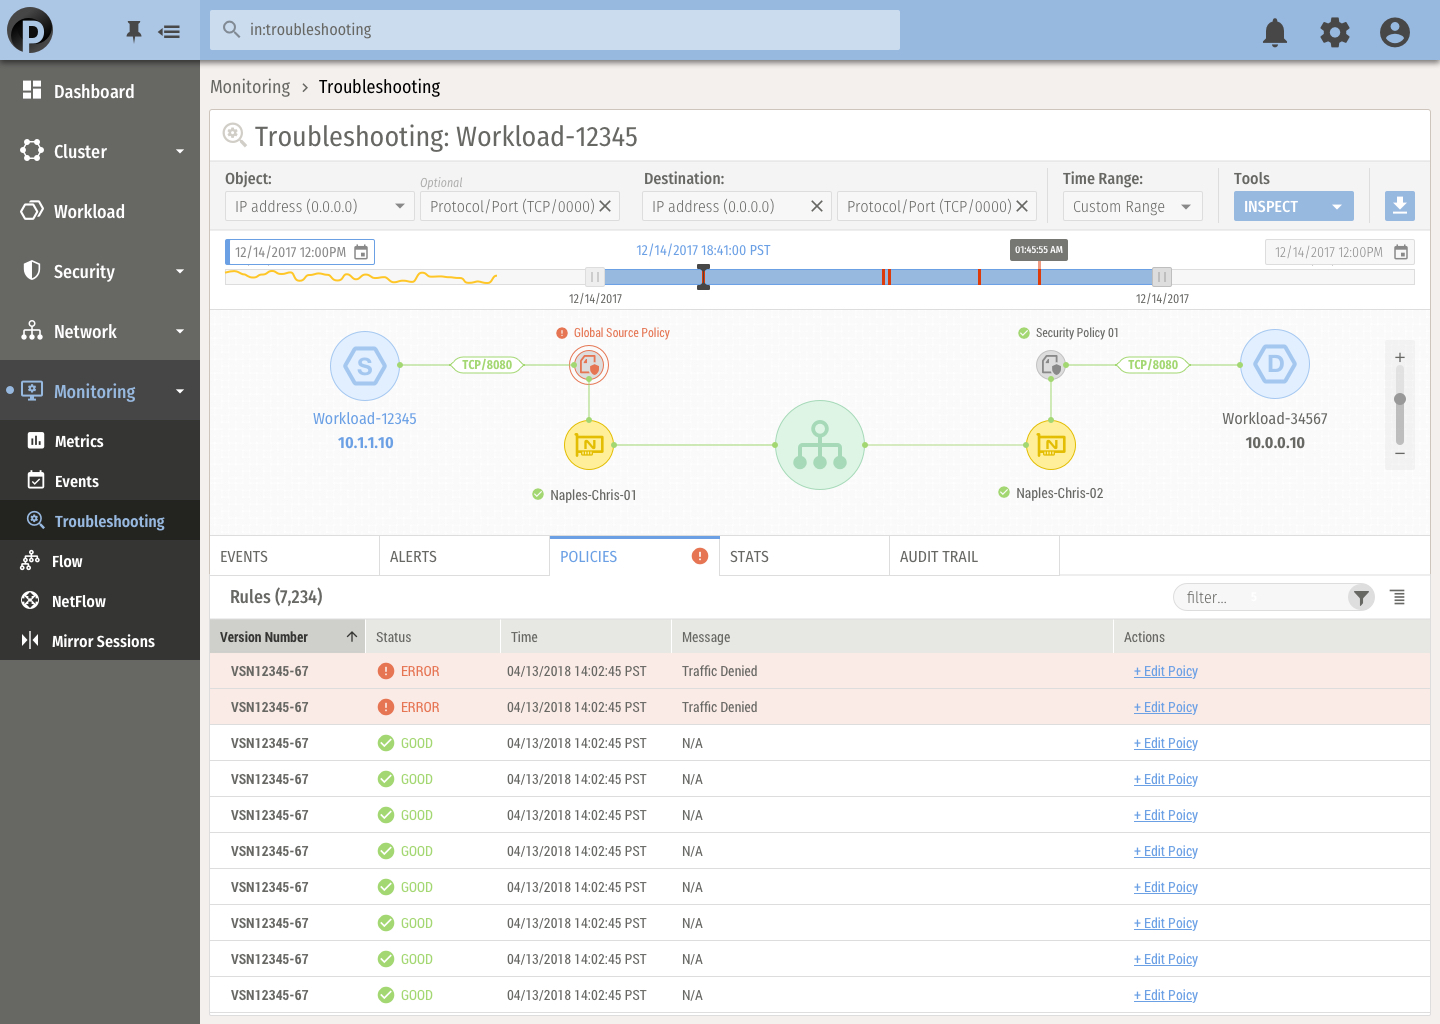
Troubleshooting "East-West" traffic often feels like finding a needle in a haystack. This view provides a granular look at every packet flow. Designers focused on making complex metadata—like source/destination IPs, protocol types, and port behavior—readable so engineers can instantly identify blocked or misrouted traffic.
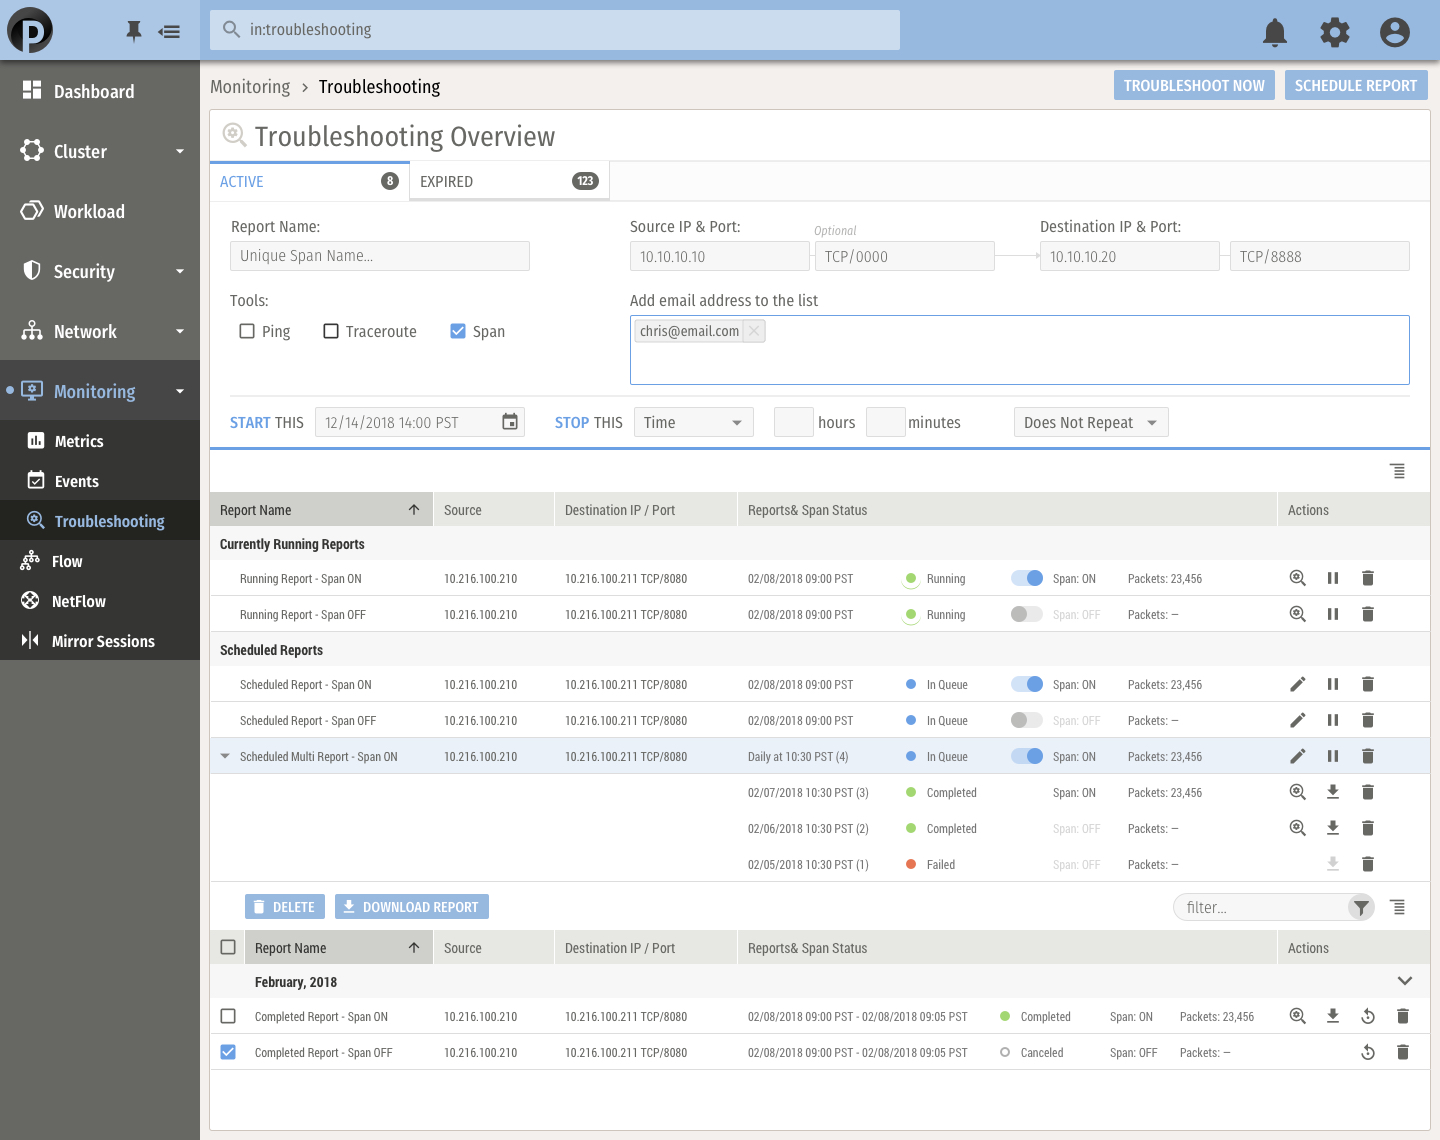
Key Troubleshooting Features:
When a workload loses connectivity, the first question is usually: "Is it the firewall?" This interface allows admins to simulate and verify policy impacts. We designed a clear "Audit vs. Enforce" toggle and log view to help users determine exactly which security rule is causing a connectivity issue.
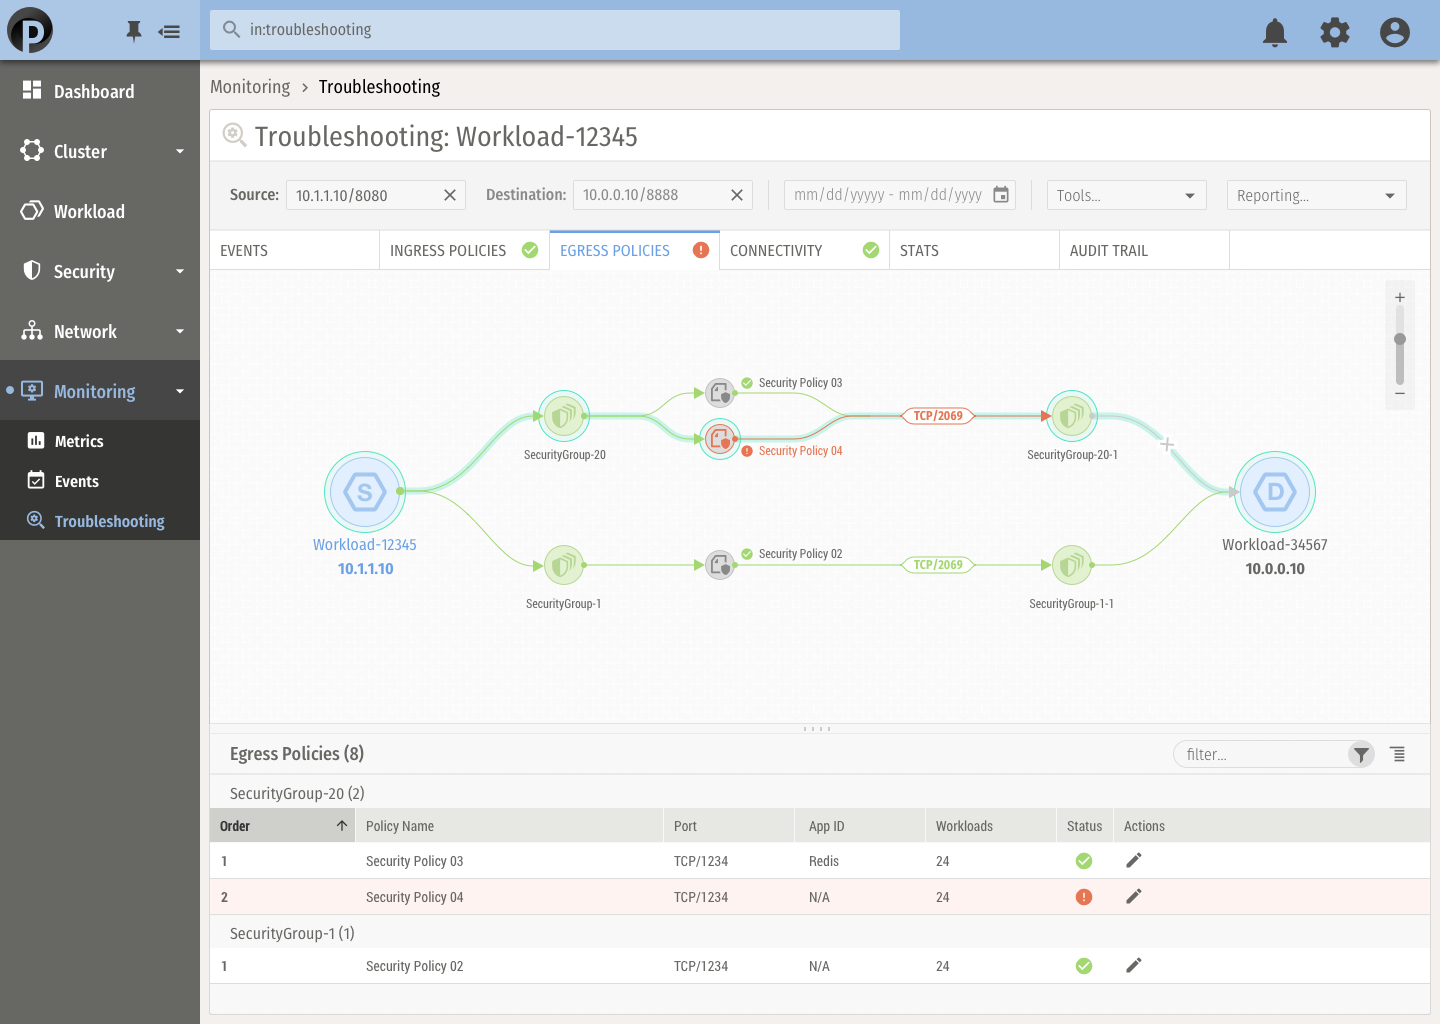
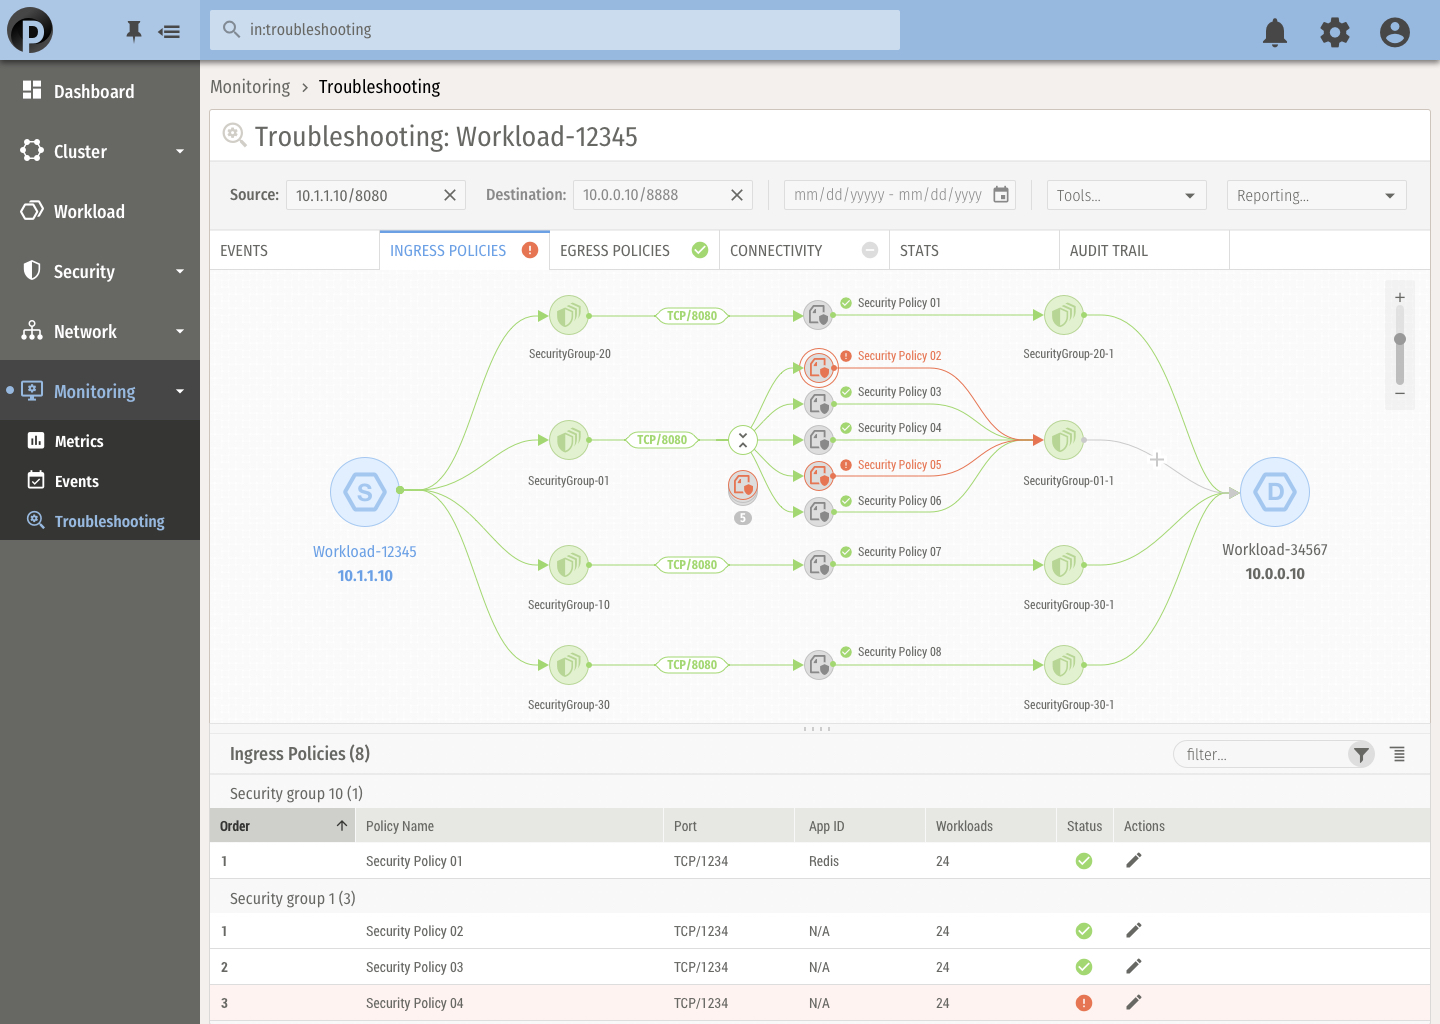
To simplify troubleshooting in complex multi-tenant environments, we created an interactive topology map. This allows users to trace the logical and physical path of a data packet across switches and server nodes, identifying exactly where a "break" in the chain is occurring.
Key Troubleshooting Features: